Capturing PM2.5
I started this new experiment using ESPertino coupled with the PPD42NS indoor (at home). Two tests were made: for the first I left opened the window in front of the sensor for the second one I follow the advice to close the in-front-of window in a way not to negatively affect the light intercepted by the detector.
 |
| PPD42NS with opened window |
The experiment took about 1 hour and half and in the following charts I reported the results:


These three charts are relative to three different value obtained through as many formulas:
- Ratio: % of the signal at LOW level (in which the device senses the presence of particles - PM2.5 in this case);
- Weight: ug / m^3 obtained from the follwing formula that relatesthe previous ratio with the weight on m^3:
y = 3.5x + 4.75
where
y is the weight on m^3 that we want to obtain
x is the
Ratio (as previously obtained).
This formula is taken from a scientific article:
https://www.academia.edu/6046777/Field_calibrations_of_a_low-cost_aerosol_sensor_at_a_regulatory_monitoring_site_in_California?email_work_card=title
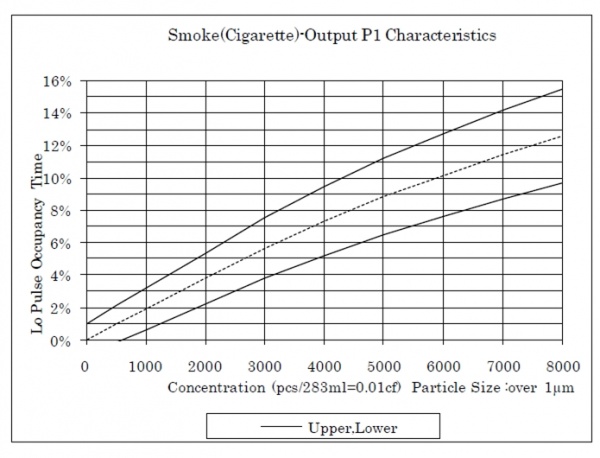
In particular from this final chart that relates the % of occupancy of the LOW level in PPD42NS with the ug/m^3 (PM2.5) values of a reference instrument (see the following chart):
If someone is able to obtain a better version of this formula, I will thank her/him!!
- Particles: as the name itself says, is the number of particles on 0.01 cf (cube feet). This is also achieved by a formula:
y=1.1*x^3-3.8*x^2+520*x+0.62
where y is the value we want to obtain and x is the Ratio.

At first glance it can be appreciated a wide variation between the first part and the last part of data. Anyway, back to us we can notice the different results between the three charts obtained with the open little window and the following obtained covering it:


Yep, a greater uniformity is suddenly visible in this second part of the experiment!
Many fewer zeroes values and not so obvious overhangs.
 |
| PPD42NS with covered window |
 |
| This is the only way in which the particles can access |
Conclusion
It's clear that in the first part we have a lot of values out of average of an unpolluted room. (A lot more than the norm: more than 60 ug/m^3!!).
In the second case the values doesn't exceed the max value permitted as a peak of 20 ug/m^3.
Note
The peak for the first test could be derived from cooking, strange movements of the device, etc. Although I would believe in all of them only for a short time and sporadic situations (not for so long time, 5/7 mins continuously).
What do you think about it?
Next steps
Possible next steps are:
- adding a fan to force the air through the device
- take outdoor tests
...continue!!


