Wednesday, 12 June 2019
Friday, 31 May 2019
Weather Station improvement
In these days, I though about the possibility to add another sensor to my personal weather station: the UV sensor: more useful for human skin especially in areas where I actually live (South-Italy: sunny most of the year).
Further specifications can be found at the following link:
https://cdn.sparkfun.com/datasheets/Sensors/LightImaging/ML8511_3-8-13.pdf
Further specifications can be found at the following link:
https://cdn.sparkfun.com/datasheets/Sensors/LightImaging/ML8511_3-8-13.pdf
![]() |
| A picture of the sensor |
Thursday, 30 May 2019
Thursday, 23 May 2019
My name on Mars
My name will be sent to Mars by the rover MARS 2020 thanks to a NASA's initiative.
The launch window available is provided between 27 of july and 5th june 2020 from Cape Canaveral (Florida).
The rover will arrive on Mars on 18 july 2021, in the Jezero crater.
Mission will take a martian year (about 687 terrestrial days).
You can sen you name writing it on the following link:
https://mars.nasa.gov/participate/send-your-name/mars2020/
This is mine:
Happy journey!
The launch window available is provided between 27 of july and 5th june 2020 from Cape Canaveral (Florida).
The rover will arrive on Mars on 18 july 2021, in the Jezero crater.
Mission will take a martian year (about 687 terrestrial days).
You can sen you name writing it on the following link:
https://mars.nasa.gov/participate/send-your-name/mars2020/
This is mine:
Happy journey!
Friday, 10 May 2019
ESPertino and the PPD42NS (indoor experiment)
I started this new experiment using ESPertino coupled with the PPD42NS indoor (at home). Two tests were made: for the first I left opened the window in front of the sensor for the second one I follow the advice to close the in-front-of window in a way not to negatively affect the light intercepted by the detector.
![]() |
| PPD42NS with opened window |
The experiment took about 1 hour and half and in the following charts I reported the results:
These three charts are relative to three different value obtained through as many formulas:
- Ratio: % of the signal at LOW level (in which the device senses the presence of particles - PM2.5 in this case);
- Weight: ug / m^3 obtained from the follwing formula that relatesthe previous ratio with the weight on m^3:
y = 3.5x + 4.75
This formula is taken from a scientific article:
https://www.academia.edu/6046777/Field_calibrations_of_a_low-cost_aerosol_sensor_at_a_regulatory_monitoring_site_in_California?email_work_card=title
In particular from this final chart that relates the % of occupancy of the LOW level in PPD42NS with the ug/m^3 (PM2.5) values of a reference instrument (see the following chart):
If someone is able to obtain a better version of this formula, I will thank her/him!!
- Particles: as the name itself says, is the number of particles on 0.01 cf (cube feet). This is also achieved by a formula:
y=1.1*x^3-3.8*x^2+520*x+0.62
where y is the value we want to obtain and x is the Ratio.
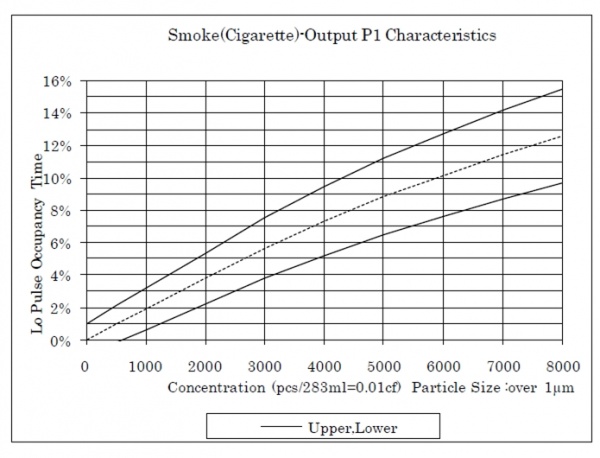
This formula is obtained from a code written here: http://wiki.seeedstudio.com/Grove-Dust_Sensor/#jump and the references to the PM2.5 are the particles contained in a cigarette's smoke:

At first glance it can be appreciated a wide variation between the first part and the last part of data. Anyway, back to us we can notice the different results between the three charts obtained with the open little window and the following obtained covering it:


Yep, a greater uniformity is suddenly visible in this second part of the experiment! Many fewer zeroes values and not so obvious overhangs.
Conclusion
It's clear that in the first part we have a lot of values out of average of an unpolluted room. (A lot more than the norm: more than 60 ug/m^3!!).
In the second case the values doesn't exceed the max value permitted as a peak of 20 ug/m^3.
Note
The peak for the first test could be derived from cooking, strange movements of the device, etc. Although I would believe in all of them only for a short time and sporadic situations (not for so long time, 5/7 mins continuously).
What do you think about it?
Next steps
Possible next steps are:
Yep, a greater uniformity is suddenly visible in this second part of the experiment! Many fewer zeroes values and not so obvious overhangs.
![]() |
| PPD42NS with covered window |
![]() |
| This is the only way in which the particles can access |
Conclusion
It's clear that in the first part we have a lot of values out of average of an unpolluted room. (A lot more than the norm: more than 60 ug/m^3!!).
In the second case the values doesn't exceed the max value permitted as a peak of 20 ug/m^3.
Note
The peak for the first test could be derived from cooking, strange movements of the device, etc. Although I would believe in all of them only for a short time and sporadic situations (not for so long time, 5/7 mins continuously).
What do you think about it?
Next steps
Possible next steps are:
- adding a fan to force the air through the device
- take outdoor tests
...continue!!
Subscribe to:
Posts (Atom)
-
One of my dreams was to measure particulate in the air and make this operation simple. Thanks to the PPD42NS sensor this is possible. O...
-
It's a lot of time I didn't write anything on this blog. This is the perfect opportunity to returning on my personal weather statio...
-
Just a few book... HTML5 CSS3 jQuery Javascript Markdown Any languages (important!!) Wordpress Take a look!


